This “Candlestick Dashboard” indicator scans ALL currency pairs and ALL time-frames for powerful candlestick patterns that have the GREATEST probability of winning…
The indicator displays all detected patterns on ONE convenient dashboard. And it recognizes over 30 powerful candlestick patterns (including reversal, continuation, trend exhaustion patterns — and single, double, and triple candlestick patterns…)
You no longer need to manually scan every pair and time-frame for candlestick patterns. The dashboard does all the hard work for you.
With just one look at the dashboard, you’ll instantly know which candlestick pattern has just formed on every pair and every time-frame (from 1-minute to monthly)…
Hi there,
Do you like candlestick patterns?
I mean, what’s not to like about it? They stand the test of time. They’re universal (work on every symbol and every time-frame). And they’re very useful at fine-tuning your entries and exits.
And they’re versatile: There are Reversal and Continuation and Exhaustion patterns. Each of these patterns gives you insight into what the market trend is likely to do next (continue or weaken or reverse).
But the reality is:
There are not a lot of traders who actually use candlestick patterns every day as we would think.
Why? The problem is:
1. If you want to use candlestick patterns effectively, you need to learn the definition of 30+ patterns. And you need to quickly identify the pattern when it shows up on your chart. Takes a lot of time and practice.
2. Even if you’ve managed to learn all the patterns, then every day you have to manually go through every pair and every time-frame to find these patterns. It’s a tiring routine.
But don’t fret…
If you want to eliminate all the stress, frustration, and overwhelm you feel scanning the markets manually for candlestick patterns, here’s the good news…
Let our “Candlestick Dashboard” indicator do all the heavy lifting and identify 30+ powerful candlestick patterns for you…
First, it will scan ALL currency pairs and ALL time-frames for over 30 powerful candlestick patterns. And all these calculations are done so fast – literally within seconds – you won’t even notice the time.
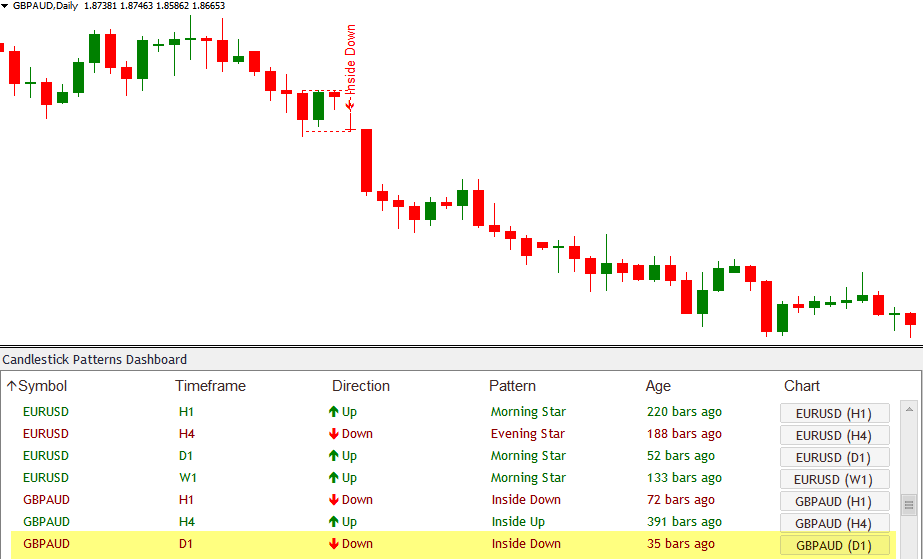
Then, the indicator will display a beautiful dashboard on your chart where you can see exactly what candlestick pattern has recently formed on EVERY pair, EVERY time-frame.
Take a look below to see how cool it really is:
The indicator displays all detected patterns on ONE convenient dashboard. And it recognizes over 30 powerful candlestick patterns (including reversal, continuation, trend exhaustion patterns — and single, double, and triple candlestick patterns…)
You no longer need to manually scan every pair and time-frame for candlestick patterns. The dashboard does all the hard work for you.
With just one look at the dashboard, you’ll instantly know which candlestick pattern has just formed on every pair and every time-frame (from 1-minute to monthly)…
Hi there,
Do you like candlestick patterns?
I mean, what’s not to like about it? They stand the test of time. They’re universal (work on every symbol and every time-frame). And they’re very useful at fine-tuning your entries and exits.
And they’re versatile: There are Reversal and Continuation and Exhaustion patterns. Each of these patterns gives you insight into what the market trend is likely to do next (continue or weaken or reverse).
But the reality is:
There are not a lot of traders who actually use candlestick patterns every day as we would think.
Why? The problem is:
1. If you want to use candlestick patterns effectively, you need to learn the definition of 30+ patterns. And you need to quickly identify the pattern when it shows up on your chart. Takes a lot of time and practice.
2. Even if you’ve managed to learn all the patterns, then every day you have to manually go through every pair and every time-frame to find these patterns. It’s a tiring routine.
But don’t fret…
If you want to eliminate all the stress, frustration, and overwhelm you feel scanning the markets manually for candlestick patterns, here’s the good news…
Let our “Candlestick Dashboard” indicator do all the heavy lifting and identify 30+ powerful candlestick patterns for you…
First, it will scan ALL currency pairs and ALL time-frames for over 30 powerful candlestick patterns. And all these calculations are done so fast – literally within seconds – you won’t even notice the time.
Then, the indicator will display a beautiful dashboard on your chart where you can see exactly what candlestick pattern has recently formed on EVERY pair, EVERY time-frame.
With just one look at the dashboard, you’ll instantly know all the information you need to make a good trading decision. You’ll instantly know which candlestick pattern appears on every time-frame (from 1-minute to monthly) and on every currency pair.
Not only that, you’ll also know the exact direction of that pattern – whether it’s bullish or bearish. And you’ll know exactly how long ago that particular pattern showed up.
And you’re in total control. You can specify which currency pairs and which time-frame you want the indicator to scan for candlestick patterns: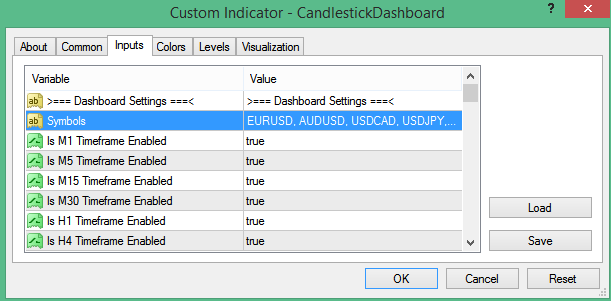
Remember, you can specify as many pairs as you like. You can also use it for indices, stocks, futures, and gold (anything your broker offers in Metatrader). Our Candlestick Dashboard will take care of it all.
Let me show you a short clip where I scroll through 18 currency pairs (and all time-frames from 1-minute to monthly) and see all the patterns on my dashboard:
But maybe the most useful feature of the Candlestick Dashboard indicator is…
Click on the symbol you want, and the indicator will open up that symbol chart with the candlestick pattern highlighted…
Take a look at this short clip to see what I mean:
That way, you can look at the dashboard first to see the overall picture across multiple time-frames. Then once you identify a candlestick pattern that you want to trade, just click on the symbol to open up the relevant chart, so you can analyze the pattern further.
And by the way, did you know that…
You can sort the dashboard in any way you like — based on Symbol, Timeframe, Direction, Pattern, or Age…
Let me show you exactly how it works:
Pretty cool, isn’t it?
Now, let me tell you about…
All Of The Best Candlestick Patterns Our “Candlestick Dashboard” Indicator Can Detect For You…
Let’s start with the top 4 performing candlestick patterns according to renowned author Thomas Bulkowski. (You can read his brilliant book “Encyclopedia of Candlestick Charts” to learn more about his research results.)
Tasuki Gap
Tasuki Gap is a continuation pattern. And in the example above, you’ll see 3 Tasuki Gap patterns on 3 different time frames: USD/CAD daily time frame, GBP/USD 4-hour time frame, and USD/CHF 15-minute time frame.
And all of these patterns correctly predicts continuation of the trend.
Breakaway
Breakaway is a high-probability reversal pattern. Look at the photo below. In this case I sorted the dashboard by Pattern, so I can easily see all Breakaway patterns.
Then, I clicked on the Breakaway patterns on EURUSD 15-minute time frame, and USDCHF 30-minute time frame to open up these charts. So you can see just how effective these Breakaway patterns really are:
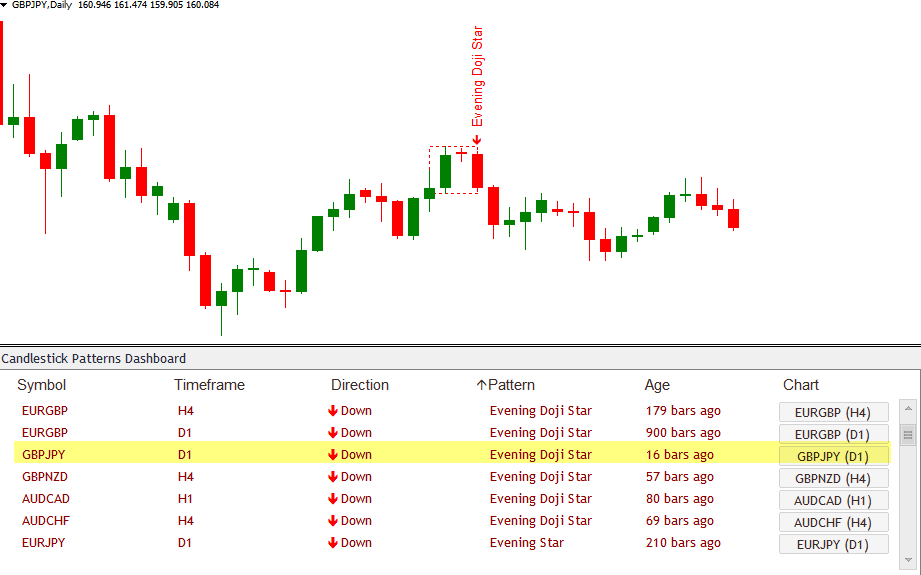
Evening Star / Evening Doji Star / Morning Star / Morning Doji Star
Let’s take a look at an example:
Three Black Crows / Three White Soldiers
These are high-probability reversal patterns. The “Three Black Crows” is indication of a bearish reversal of an uptrend. And the “Three White Soldiers” is indication of a bullish reversal of a downtrend.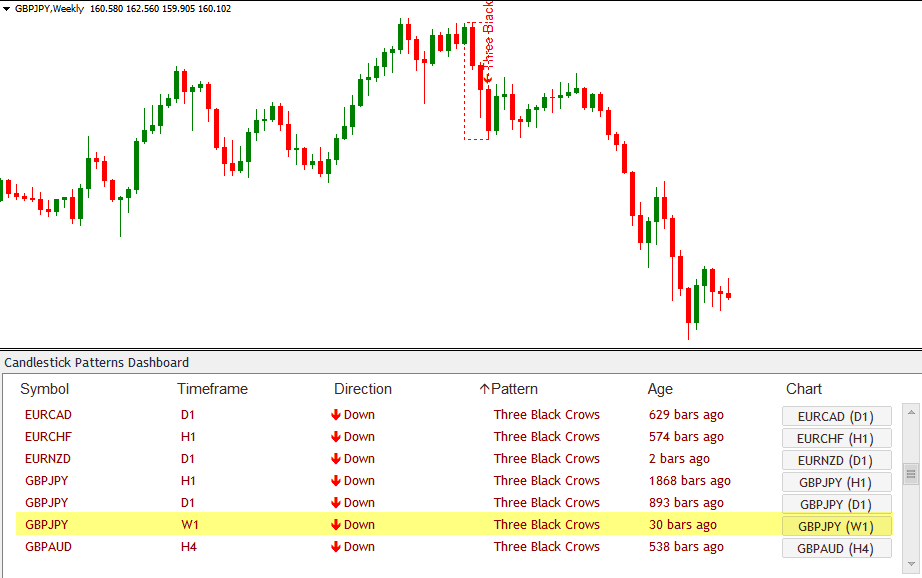
Here’s even more patterns the Candlestick Dashboard can detect for you:
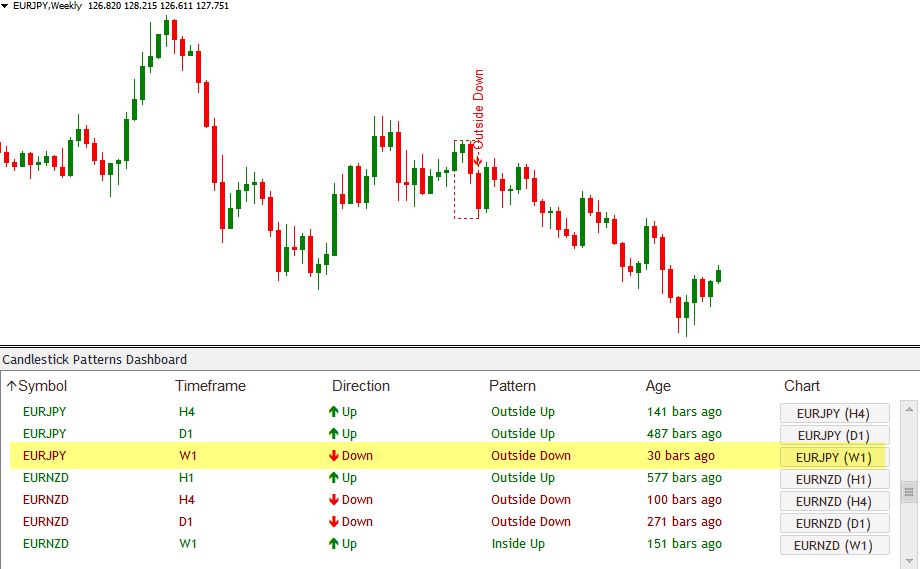
Outside Up / Outside Down
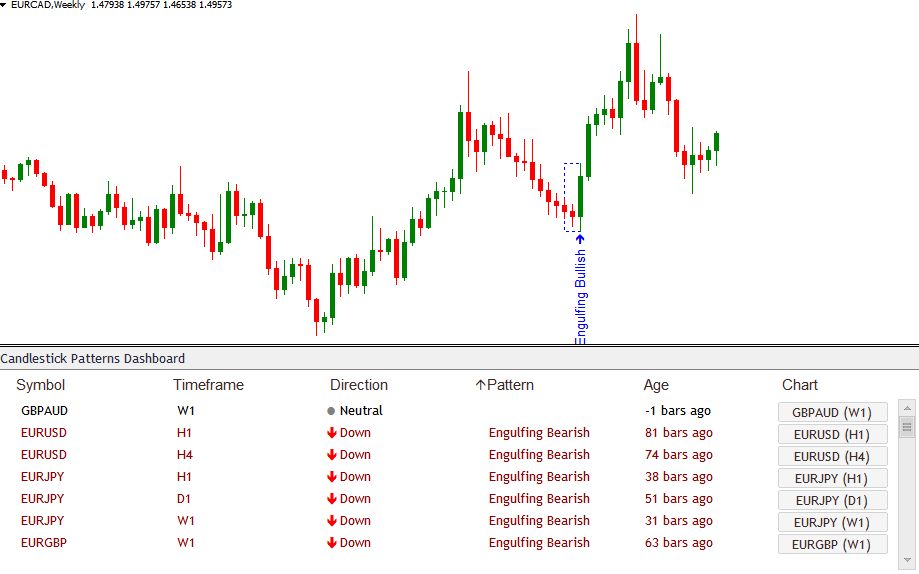
Engulfing Bullish / Engulfing Bearish
Inside Up / Inside Down
But that’s not all. Not even close.
In addition, the “Candlestick Dashboard” indicator also detects the following reversal patterns:
Hammer / Shooting Star / Hanging Man
Piercing / Dark Cloud
Harami
Belt Hold
Kicker
Squeeze Alert
Fakey / Hikake
Next…
Here’s just some Continuation patterns the “Candlestick Dashboard” indicator can detect for you…
Rising Three / Falling Three (and similar patterns like Rising Four / Falling Four, Rising Five / Falling Five)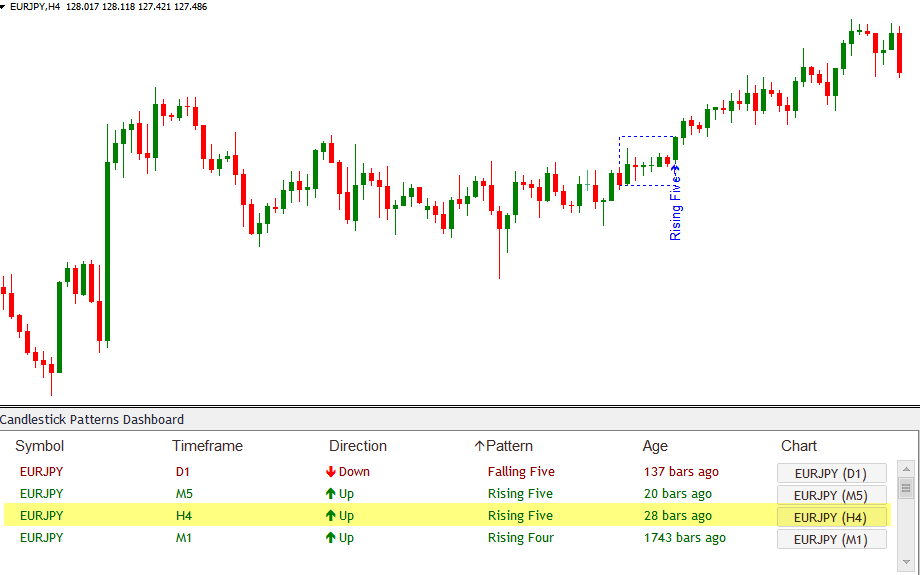
These are the best continuation patterns in our opinion. When these patterns show up, there’s a high probability that the current trend will continue.
Marubozu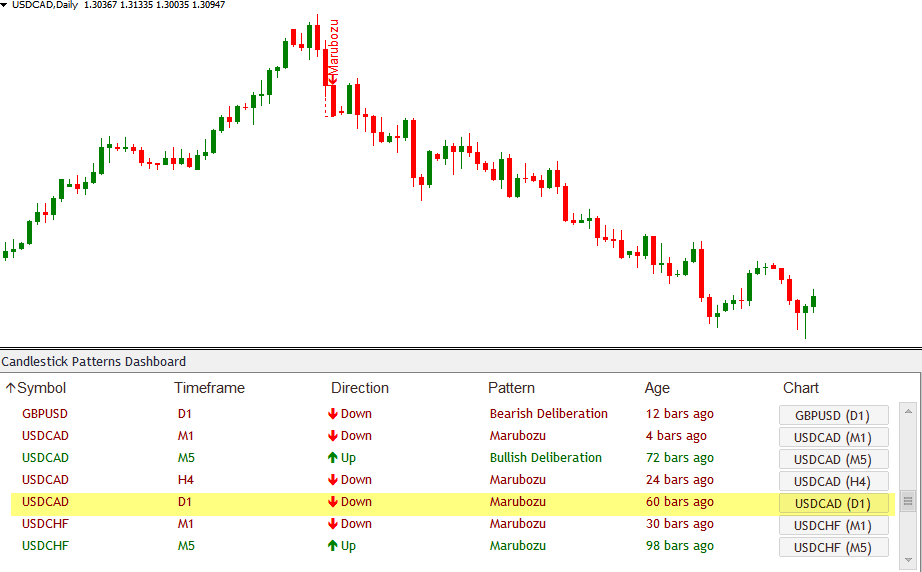
But that’s not all. Other continuation patterns our “Harmonic Dashboard” can detect includes: Windows, Side by Side Gap…
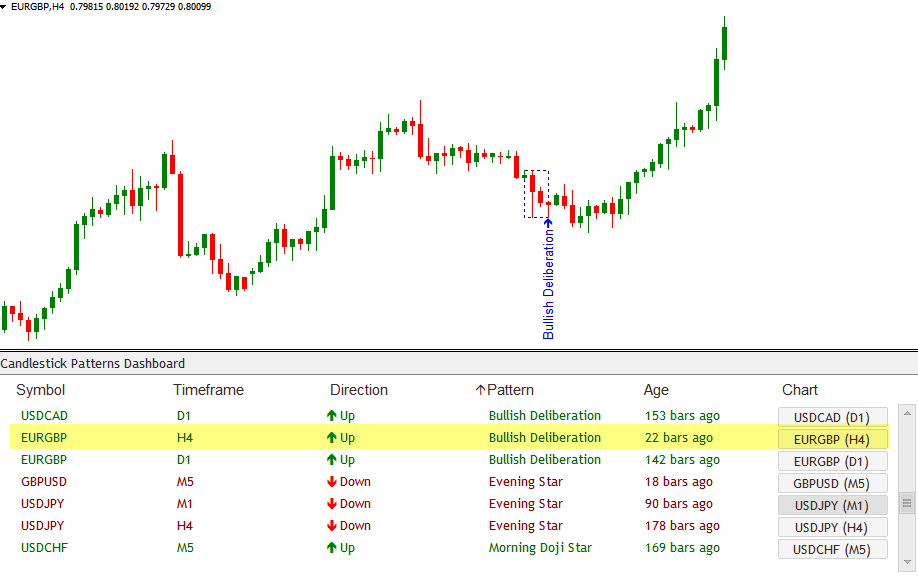
Plus, the “Candlestick Dashboard” indicator can also detect Exhaustion patterns…
Include: Deliberation and Advance Block / Descent Block. These patterns show incision in the markets. And there’s a great chance that the current trend is exhausted and a trend reversal is imminent.
And maybe the most useful part about candlestick patterns is that…
These candlestick patterns are UNIVERSAL. They work on all time-frames and all currency pairs (any instrument for that matter)…
For example, previously you’ve seen how Tasuki Gap patterns work on 3 different time frames: USD/CAD daily time frame, GBP/USD 4-hour time frame, and USD/CHF 15-minute time frame.
By the way, did you know that…
The Candlestick Dashboard indicator also gives you pop-up, visual, and audio alerts as soon as a candlestick pattern has completed.
So you will NEVER miss out on any important trade opportunity.
Technical details:
– This indicator works on Metatrader 4
– Current version: 1.0
– You’ll get free updates and upgrades whenever we’ll release a new version.
– You can use the indicator on ANY instrument your Metatrader 4 offers: FX pairs, Gold, Silver, Indices, Futures, Stocks…
I’ll see you inside the member area,
Mt4 Live
CHOOSE THE PERFECT PLAN
₹4000
$60
FOR LIFE TIME
- Software
- 1 Indication
₹4000
$60
FOR LIFE TIME
- Software
- 1 Indication
₹8000
$110
FOR LIFE TIME
- Software
- 3 Indicators
₹8000
$110
FOR LIFE TIME
- Software
- 3 Indicators
₹12000
$160
FOR LIFE TIME
- Software
- All Indicators
₹12000
$160
FOR LIFE TIME
- Software
- All Indicators