The “Price Action Dashboard” Indicator Scans ALL Currency Pairs & ALL Time-Frames For Powerful Price Action Patterns That Have The Greatest Probability Of Winning…The name says it all. This “Price Action Dashboard” scans all currency pairs and all time-frames for 5 powerful price action patterns that have the greatest probability of winning:
Pin Bar, Double Bar High Lower Close, Double Bar Low Higher Close, Bearish Outside Vertical Bar, and Bullish Outside Vertical Bar.(If you’re not familiar with any of these patterns, click here to read our article on these high-probability patterns…)
And not only that, the indicator also displays a beautiful dashboard on your chart where you can see exactly what price action pattern has recently formed on EVERY pair, EVERY time-frame.
Take a look below to see how cool it really is:
You no longer need to manually scan every pair and time-frame. The dashboard does all the hard work for you.
With just one which pattern appears on every time-frame (from 1-minute to monthly) and on every currency pair.
Not only that, you’ll also know the exact direction of that pattern – whether it’s bullish or bearish. And you’ll know exactly how long ago that particular pattern showed u look at the dashboard, you’ll instantly know which pattern has just formed on every pair and every time-frame (from 1The indicator displays all detected Price Action patterns on ONE convenient dashboard.
-minute to monthly)…
With just one look at the dashboard, you’ll instantly know all the information you need to make a good trading decision.
You’ll instantly knowp.
And you’re in total control. You can specify which currency pairs and which time-frame you want the indicator to scan for Price Action patterns:
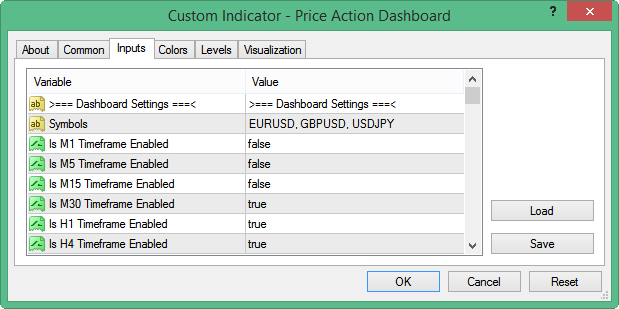
Remember, you can specify as many pairs as you like.
You can also use it for indices, stocks, futures, and gold (anything your broker offers in Metatrader).
Our Price Action Dashboard takes care of it all.
Let me show you a short clip where I scroll through 20 currency pairs (and all time-frames from 1-minute to monthly) and see all the patterns on my dashboard:
But maybe the most useful feature of the Price Action Dashboard indicator is…
Click on the symbol you want, and the indicator will open up that symbol chart with the Price Action pattern highlighted…
Take a look at this short clip to see what I mean:
That way, you can look at the dashboard first to see the overall picture across multiple time-frames.
Then once you identify a pattern that you want to trade, just click on the symbol to open up the relevant chart, so you can analyze the pattern further.
And by the way, did you know that…
You can sort the dashboard in any way you like — based on Symbol, Timeframe, Direction, or Age…
Let me show you exactly how it works:

Pretty cool, isn’t it?
By the way, did you know that…
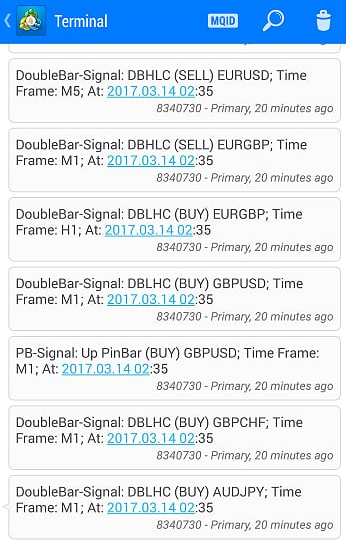
Price Action Dashboard indicator also gives you pop-up, visual, and audio alerts as soon as a pattern has appeared So you will NEVER miss out on any important trade opportunity.
Plus… based on POPULAR request:
New Feature: Push Notification – The indicator sends a push notification to your phone immediately when a new pattern appears…