This “Harmonic Dashboard” Indicator Scans ALL Currency Pairs & ALL Time-Frames For Powerful Harmonic Patterns That Have The Most Probability Of Winning…The indicator displays all detected patterns on ONE convenient dashboard. And it recognizes all of the best harmonic patterns: Gartley, Butterfly, Bat, Cypher, Crab, and Shark…
You no longer need to manually scan every pair and time-frame. The dashboard does all the hard work for you.With just one look at the dashboard, you’ll instantly know which harmonic pattern has just formed on every pair and every time-frame (from 1-minute to monthly)…
Hi there,
Harmonic patterns. You love them. Timeless, elegant, and just flat-out work.
So everybody knows that harmonic patterns work like crazy. But the reality is there are not a lot of traders who are profiting from these powerful patterns right now.
Why? Two problems:
Identifying a valid harmonic pattern by yourself is hard as hell. It requires a lot of patience and practice.
But let’s say you’re willing to spend your valuable time trying to identify every pattern manually, then you’ll also need to repeat this tedious process for each currency pair, each time-frame separately.
It’s definitely lots and lots of work. But if you want to eliminate all the stress, frustration, and overwhelm you feel scanning the markets manually for harmonic patterns, here’s the good news:
Let our “Harmonic Dashboard” indicator do all the heavy lifting for you…
First, it will scan ALL currency pairs and ALL time-frames for the most effective harmonic price patterns. And all these calculations are done so fast – literally within seconds – you won’t even notice the time.
Then, the indicator will display a beautiful dashboard on your chart where you can see exactly what harmonic pattern has recently formed on EVERY pair, EVERY time-frame.
Take a look below to see how cool it really is:
With just one look at the dashboard, you’ll instantly know all the information you need to make a good trading decision. You’ll instantly know which pattern appears on every time-frame (from 1-minute to monthly) and on every currency pair.
Not only that, you’ll also know the exact direction of that pattern – whether it’s bullish or bearish. And you’ll know exactly how long ago that particular pattern showed up.
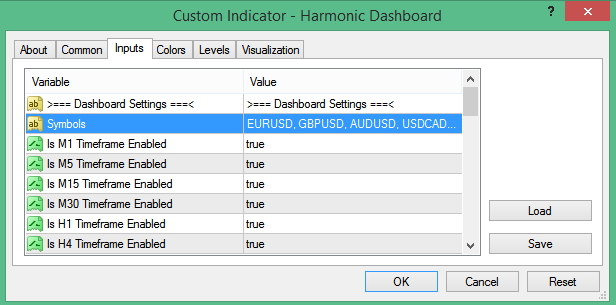
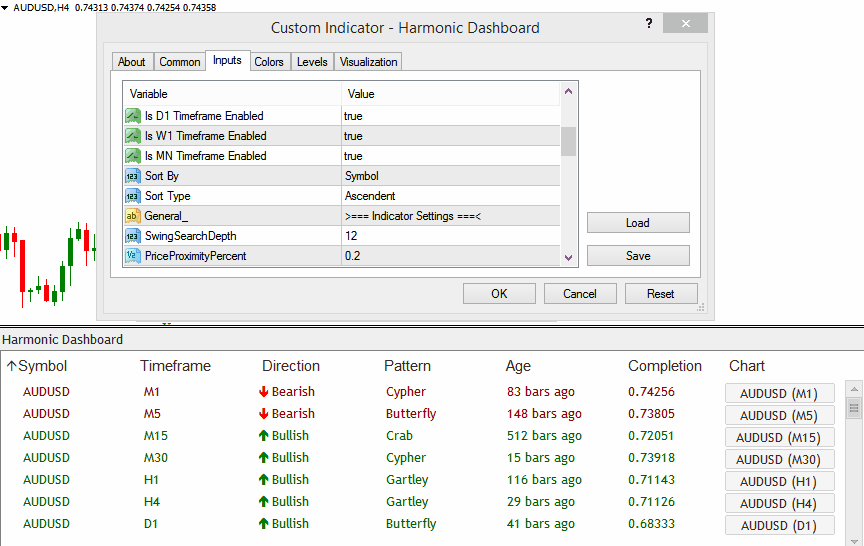
And you’re in total control. You can specify which currency pairs and which time-frame you want the indicator to scan for harmonic patterns:
Remember, you can specify as many pairs as you like. You can also use it for indices, stocks, futures, and gold (anything your broker offers in Metatrader). Our Harmonic Dashboard will take care of it all.
Let me show you a short clip where I scroll through 20 currency pairs (and all time-frames from 1-minute to monthly) and see all the patterns on my dashboard:
But maybe the most useful feature of the Harmonic Dashboard indicator is…
Click on the symbol you want, and the indicator will open up that symbol chart with the harmonic pattern highlighted...Take a look at this short clip to see what I mean:
That way, you can look at the dashboard first to see the overall picture across multiple time-frames. Then once you identify a pattern that you want to trade, just click on the symbol to open up the relevant chart, so you can analyze the pattern further.
And by the way, did you know that…
You can sort the dashboard in any way you like -- based on Symbol, Timeframe, Direction, Pattern, or Age...Let me show you exactly how it works:
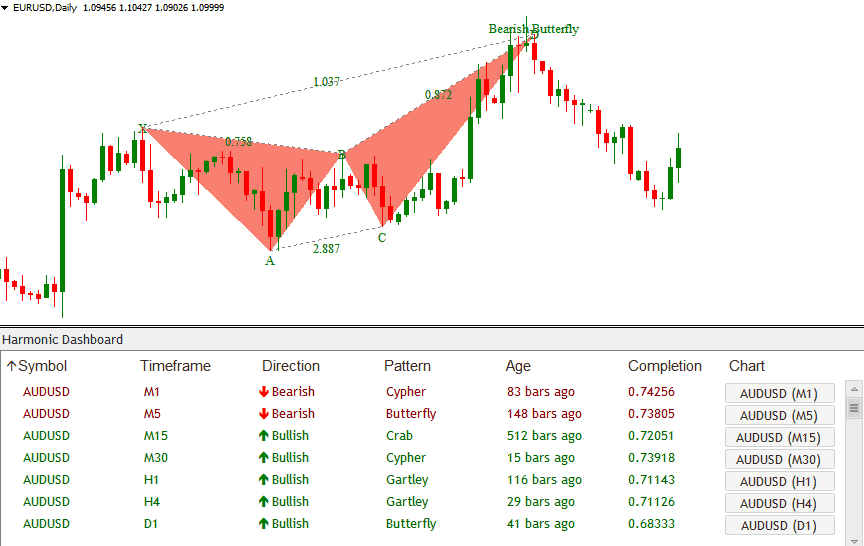
Butterfly
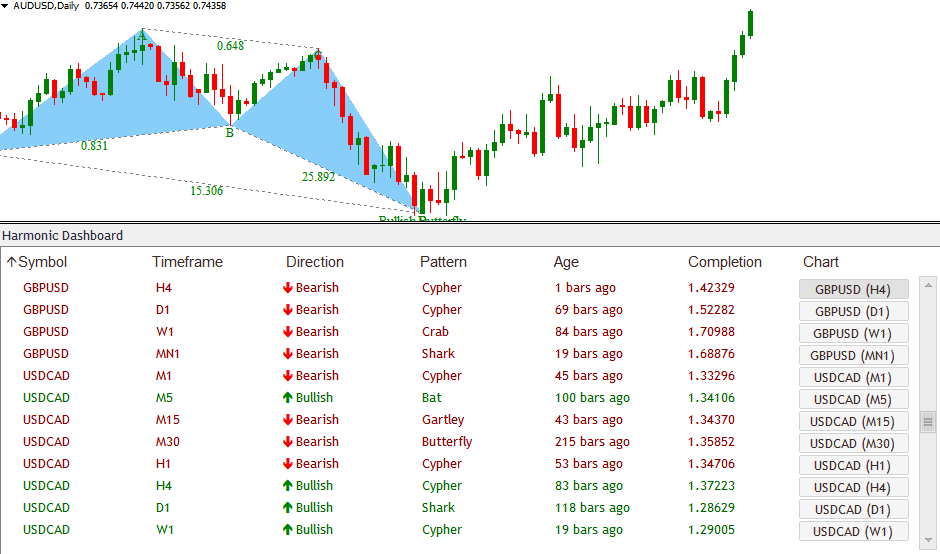
Look at the photo below. In this case, I sorted the dashboard by Pattern, so I can easily see all the Butterfly patterns.
Then, I clicked on the Butterfly patterns on USD/JPY 30-minute time frame, and EUR/USD daily time frame to open up these charts. So you can see just how effective these Butterfly patterns really are:
Butterfly
Look at the photo below. In this case, I sorted the dashboard by Pattern, so I can easily see all the Butterfly patterns.
Then, I clicked on the Butterfly patterns on USD/JPY 30-minute time frame, and EUR/USD daily time frame to open up these charts. So you can see just how effective these Butterfly patterns really are:
Cypher
Here’s a great example of the Cypher pattern in action:
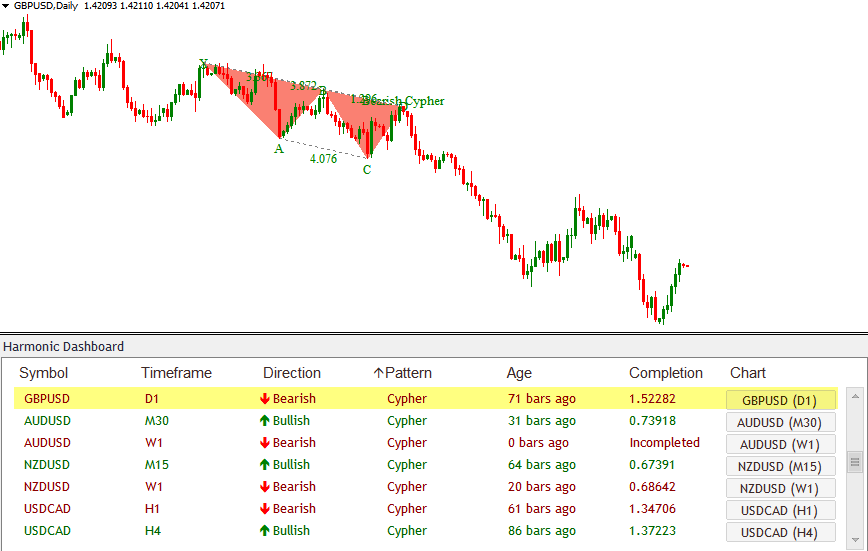
This is GBP/USD daily time-frame. And in this example, the bearish Cypher pattern indeed marks the start of a downward price swing.
Moving on…
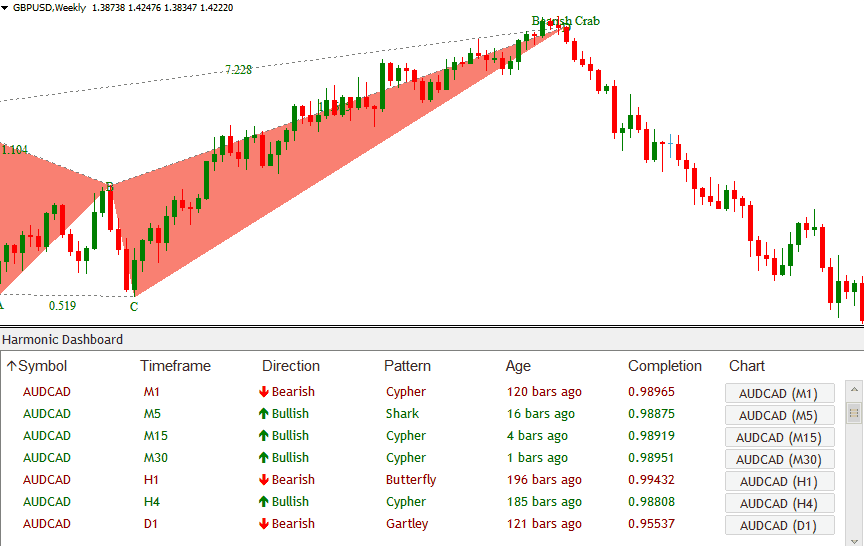
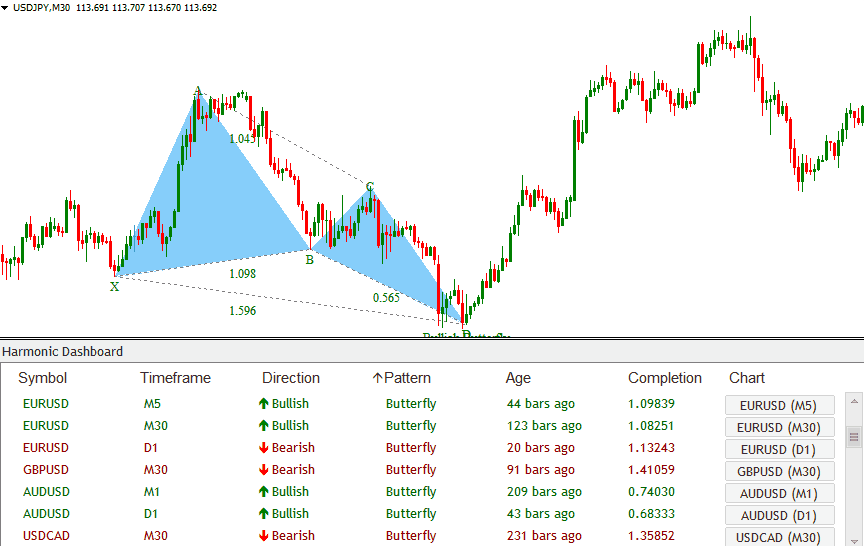
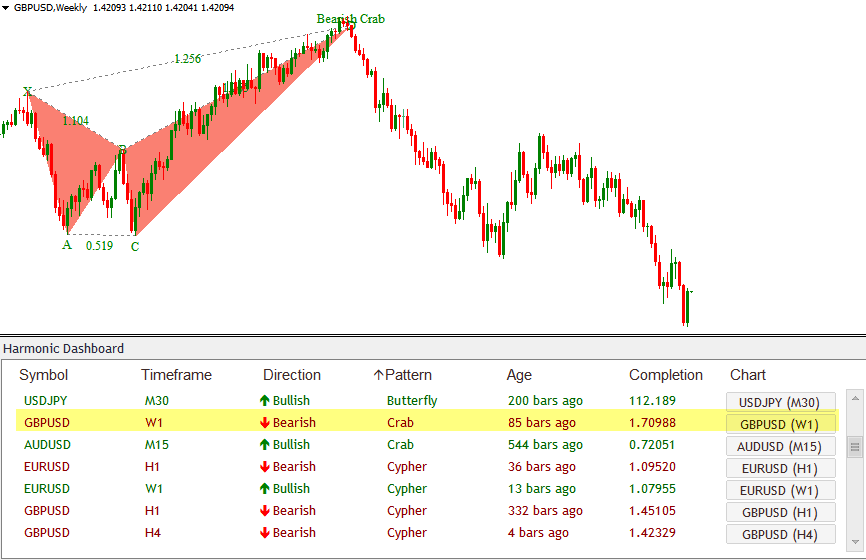
Crab
On the same pair GBP/USD, the Harmonic Dashboard indicator detects a formation of a Crab pattern on the weekly time-frame. Let’s see how it works out:
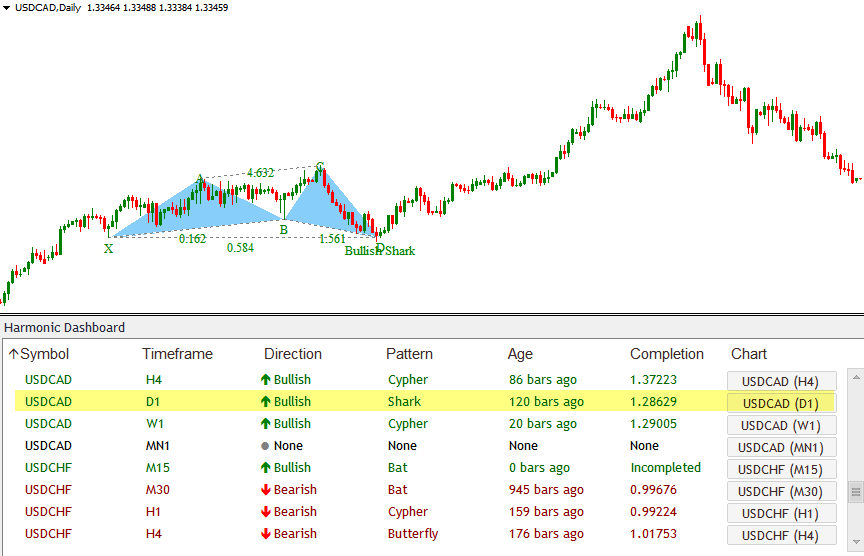
Shark
Take a look at this great example of the Shark pattern on USD/CAD daily time-frame:
And last, but certainly not least:
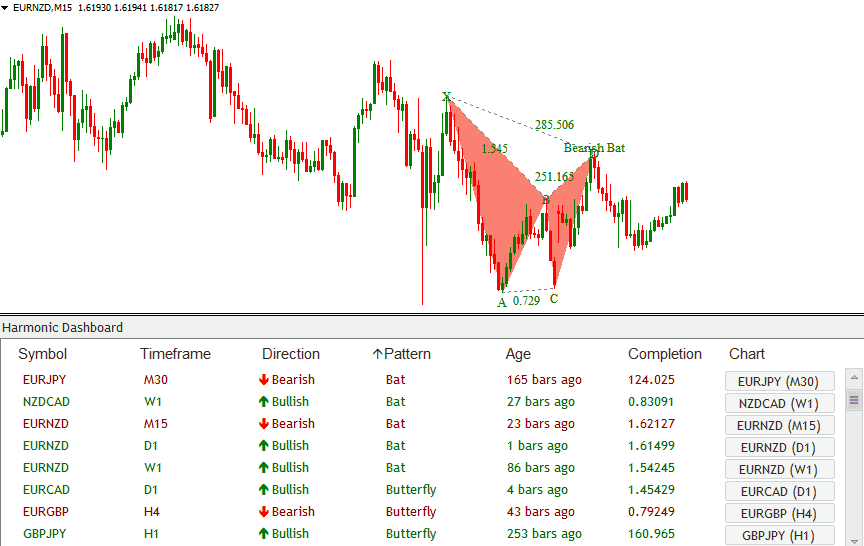
Bat
We’ll look at 2 Bat patterns, on EUR/NZD 15-minute time frame and on NZD/CAD weekly time frame to see how this pattern work:
And that’s not all. Here’s where it gets even more interesting:
If you take action today, you also get an exclusive bonus:
Exclusive Bonus: Harmonic Dashboard – Forecast Version
The amazing Harmonic Dashboard indicator scans all currency pairs for completed patterns on all time-frames. But for those who also want to look for harmonic patterns that are still unfolding and not yet completed…
…We’ve developed another version of the Harmonic Dashboard that not only detects completed patterns, but also unfolding patterns that are still forming right now.
We call it Harmonic Dashboard – Forecast. And with this version, you can immerse yourself in the formation of these harmonic patterns. Watch the pattern form in real time, and prepare for action once it’s completed.
It can’t get any cooler than this. Let’s take a look at Harmonic Dashboard – Forecast in action:
And maybe the most useful part about harmonic patterns is that…
These patterns are UNIVERSAL. They work on all time-frames and all currency pairs (any instrument for that matter)…
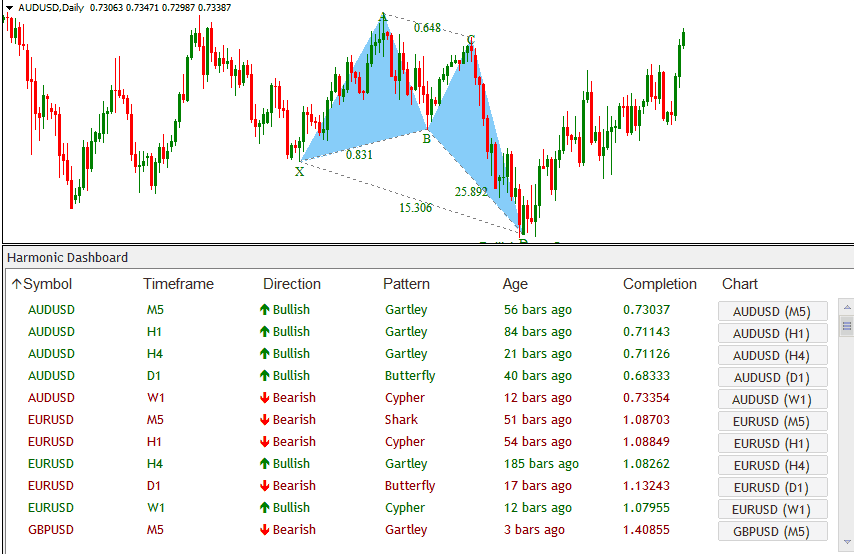
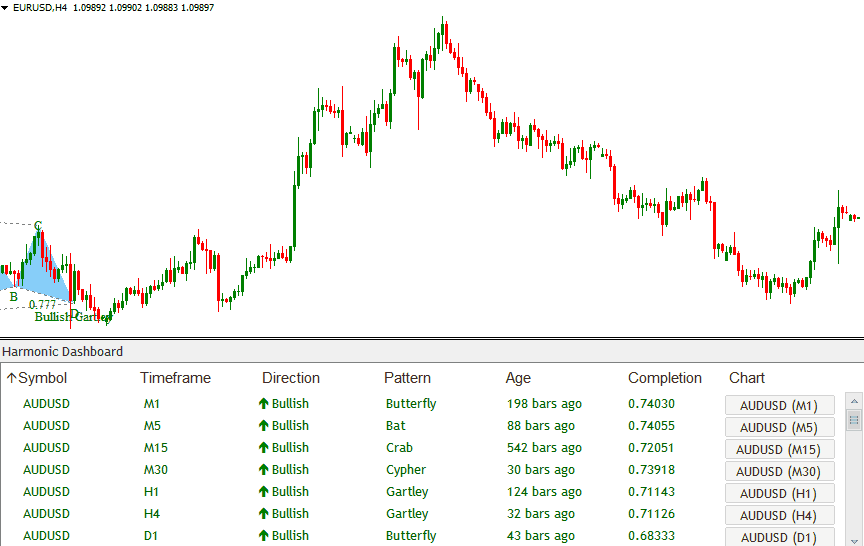
For example, let’s analyze a few harmonic patterns that have just formed on the pair AUD/USD on different time-frames:
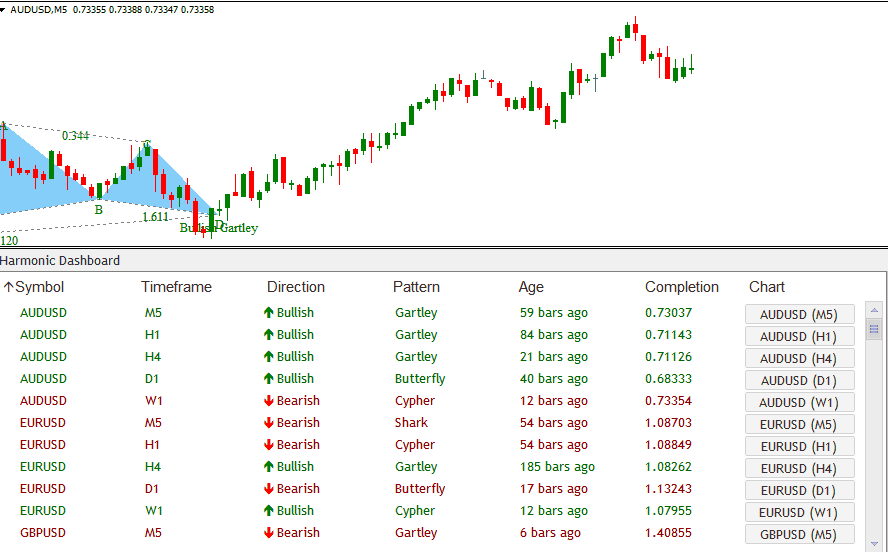
In this case, you see 2 harmonic patterns: a Gartley pattern on a lower time-frame (5-minute) and a Butterfly pattern on a higher time-frame (daily).
Both are detected by the Harmonic Dashboard indicator. And both patterns are followed by a big market move in the direction that the patterns correctly predict.
By the way, did you know that…
The Harmonic Dashboard indicator also gives you pop-up, visual, and audio alerts as soon as a harmonic pattern has completed.
So you will NEVER miss out on any important trade opportunity.